


THE latest version of the coronavirus death map has revealed only six areas in Herefordshire with deaths linked to Covid-19 in June.
A total of 57 deaths are known to have occurred in hospitals across Herefordshire up to 4pm on Saturday (July 25) with more in care homes and the community.
In June, nine deaths in Herefordshire were linked to Covid-19 in all settings, including those registered up to July 11.
In comparison, 64 were recorded in May, 44 in April and seven in April.
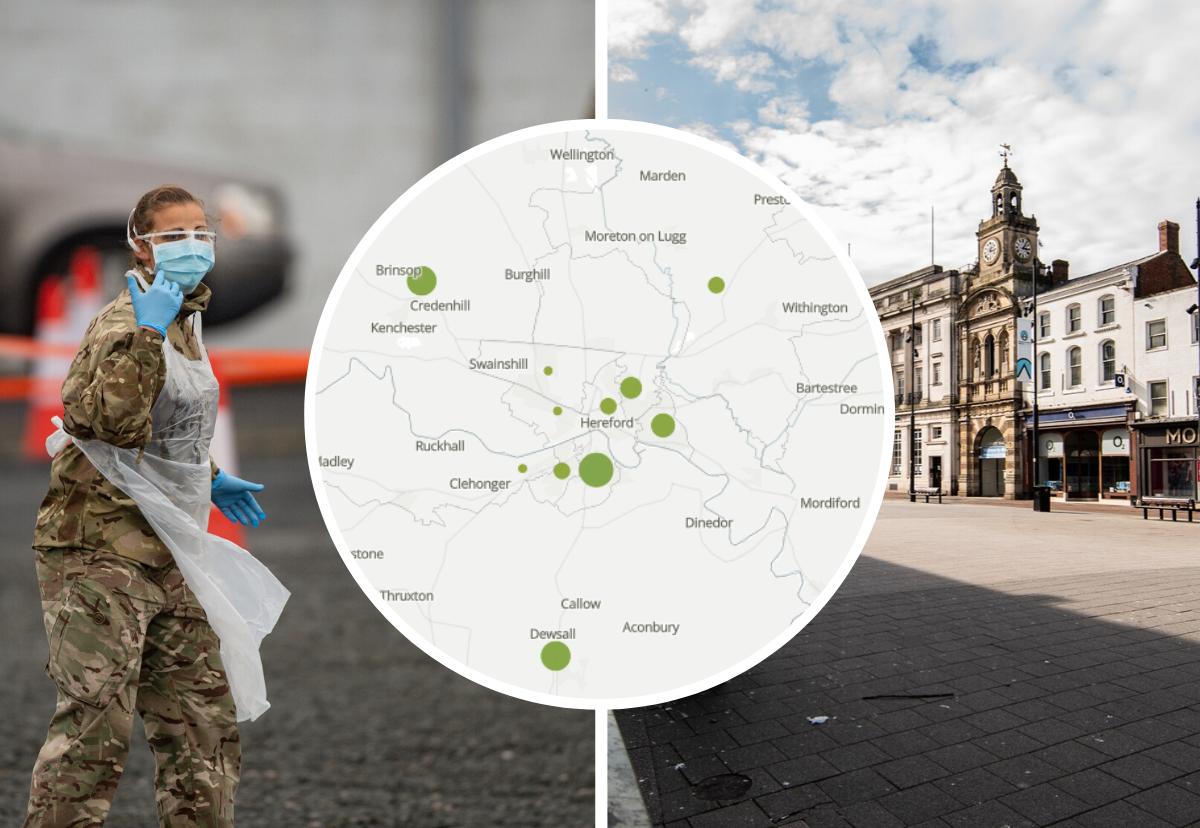
And now a map designed by the Office for National Statistics allows users to see how many people in their local area have died from a Covid-19 related illness - the data only includes the 124 deaths up to June 30.
Which parts of Herefordshire have seen the fewest coronavirus-related deaths?
Following analysis of the ONS statistics, it can be revealed that six areas out of the 23 in Herefordshire have reported only one or two deaths from the virus between March 1 and June 20.
- Belmont, Madley and Clehonger - 1
- Fownhope, Tarrington and Marcle - 2
- Golden Valley - 2
- Hereford North West - 2
- Hereford West - 1
- Leominster South - 2
Which areas have recorded the most deaths?
The ONS data which includes deaths for which coronavirus was the underlying cause, or was mentioned on the death certificate as a contributory factor, shows Ross-on-Wye has seen the most fatalities.
In total, just two areas had 10 deaths or more deaths linked to the virus from March 1 to June 20.
Areas with 10 or more deaths:
- Bromyard and Bishop's Frome - 10
- Credenhill, Weobley and Wellington - 10
- Hereford East - 10
- Hereford South - 12
- Ross-on-Wye - 21
How many deaths were recorded in June?
Since the end of May, only six areas have seen new deaths where coronavirus was mentioned on the death certificate.
It means 17 areas saw no new deaths.
Deaths linked to coronavirus in June:
- Leominster North - 1
- Bromyard and Bishop's Frome - 1
- Credenhill, Weobley and Wellington - 1
- Hereford North West - 1
- Hereford North East - 1
- Hereford East - 4
How do I find out how many coronavirus-related deaths there have been in my area?
By entering your postcode into the map, you will be able to see how many coronavirus-related deaths have occurred near you between March 1 and June 30.
This information was gathered using data from an interactive map produced by the Office for National Statistics.
And while the authority endeavour to be as specific as possible, there are certain instances where the data may be slightly skewed. For example: To protect confidentiality, a small number of deaths have been reallocated between neighbouring areas.
Points on the map are placed at the centre of the local area they represent and do not show the actual location of deaths. The size of the circle is proportional to the number of deaths
To protect confidentiality, a small number of deaths have been reallocated between neighbouring areas. Due to the method used for this, figures for some areas may be different to previously published data.
Deaths occurring between March 1, 2020 and June 30, 2020 and registered by July 11, 2020.
Figures exclude death of non-residents and are based on May 2020 boundaries.


Comments: Our rules
We want our comments to be a lively and valuable part of our community - a place where readers can debate and engage with the most important local issues. The ability to comment on our stories is a privilege, not a right, however, and that privilege may be withdrawn if it is abused or misused.
Please report any comments that break our rules.
Read the rules hereLast Updated:
Report this comment Cancel